How I Reduced Drop-off in Home Page & Improving First time user exploration in app
Note: All Icons, Images, Illustrations are from client graphics design team.


This project outlines the how we implemented to enhance user engagement and improve the browsing experience for new users.
🙋My Role & Team
1 Product Designer, 1 Graphic designer, 2 Project Managers, 2 Dev, 1 QA. I collaborated with the PMs to identify gaps, curate user research, interaction design, visual design & usability testing,
⏳Duration
5 weeks of Research and Designing
📋 About
Redesigning the first-time user experience of home page in order to improve exploration, user activities and conversion in turn increasing MTUs.
📱Status
Live App
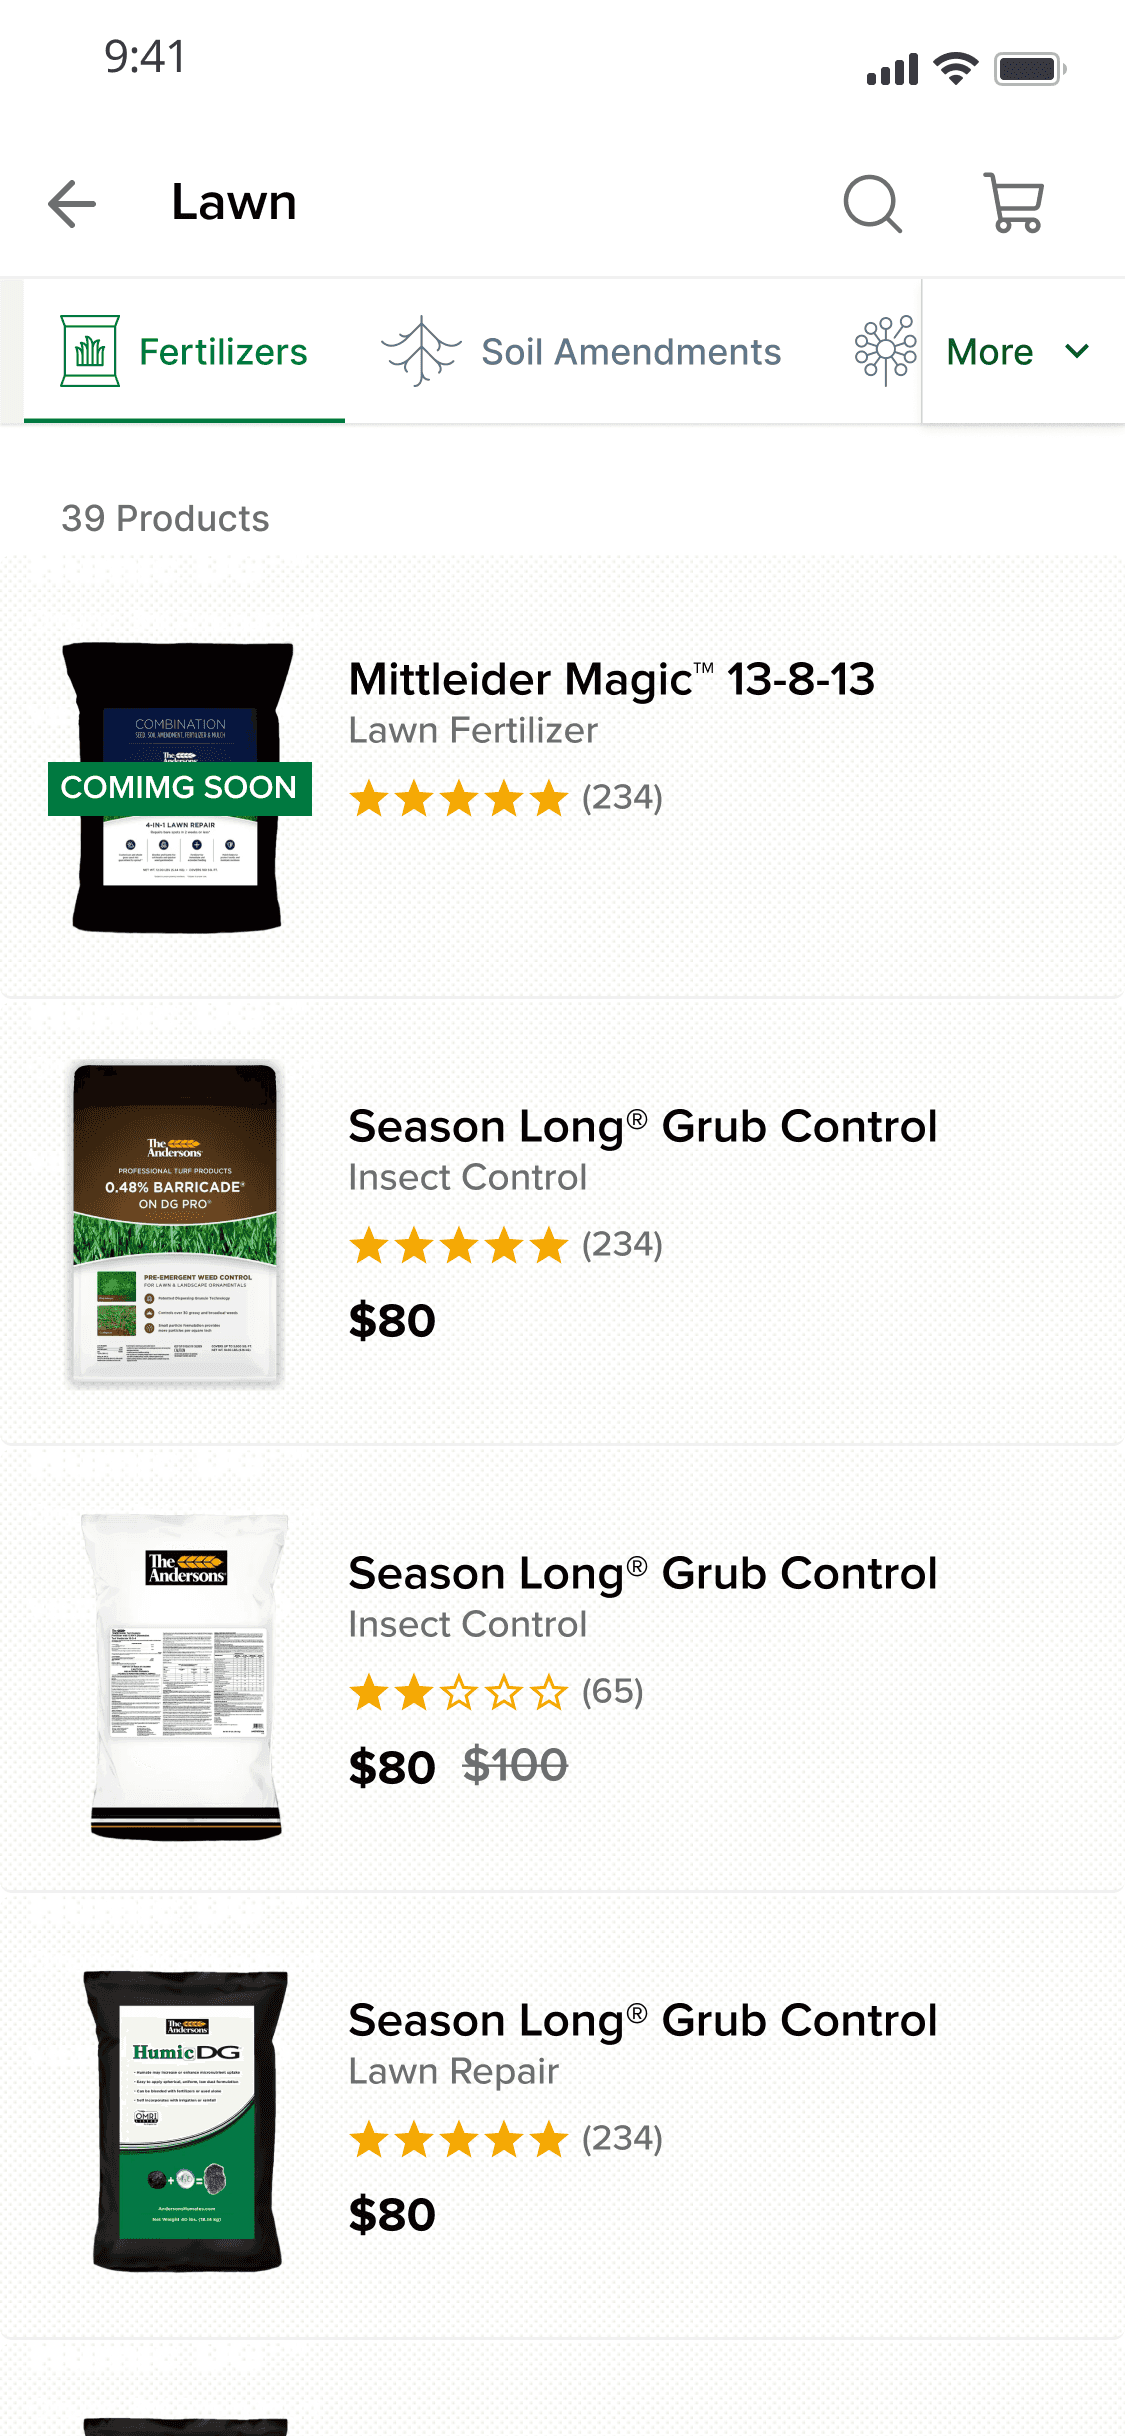
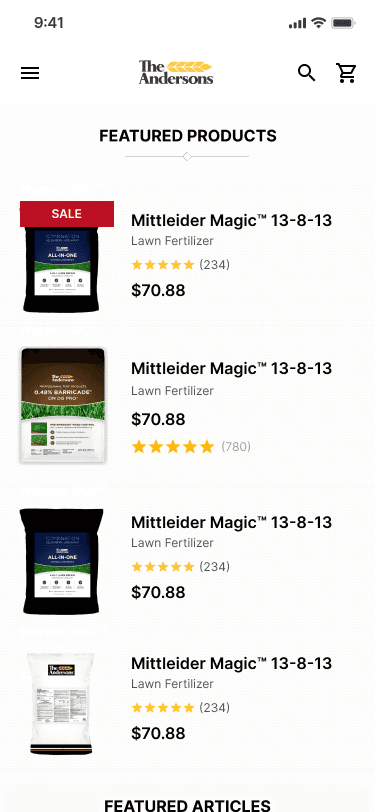
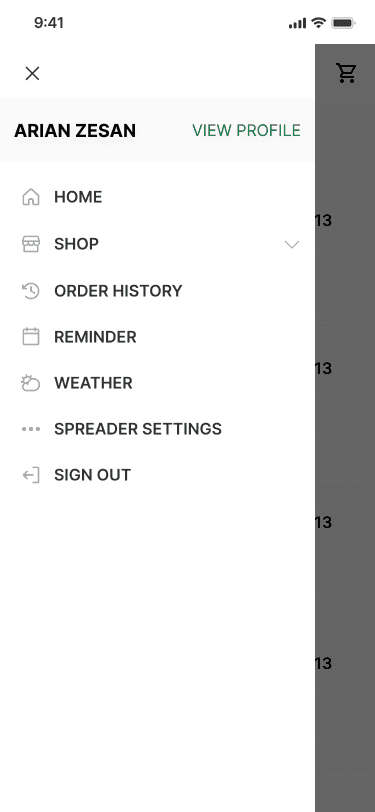
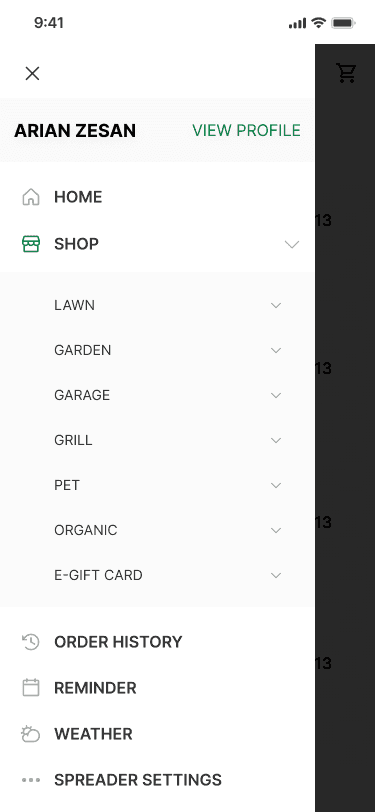
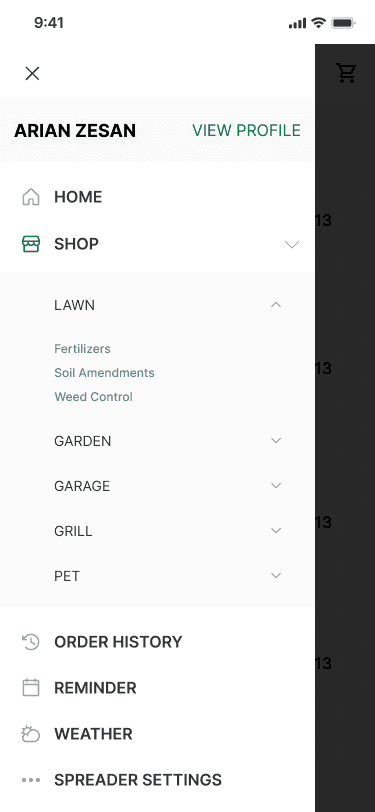
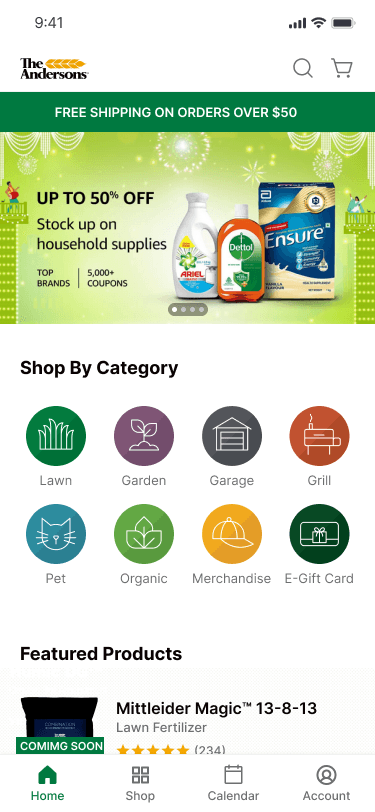
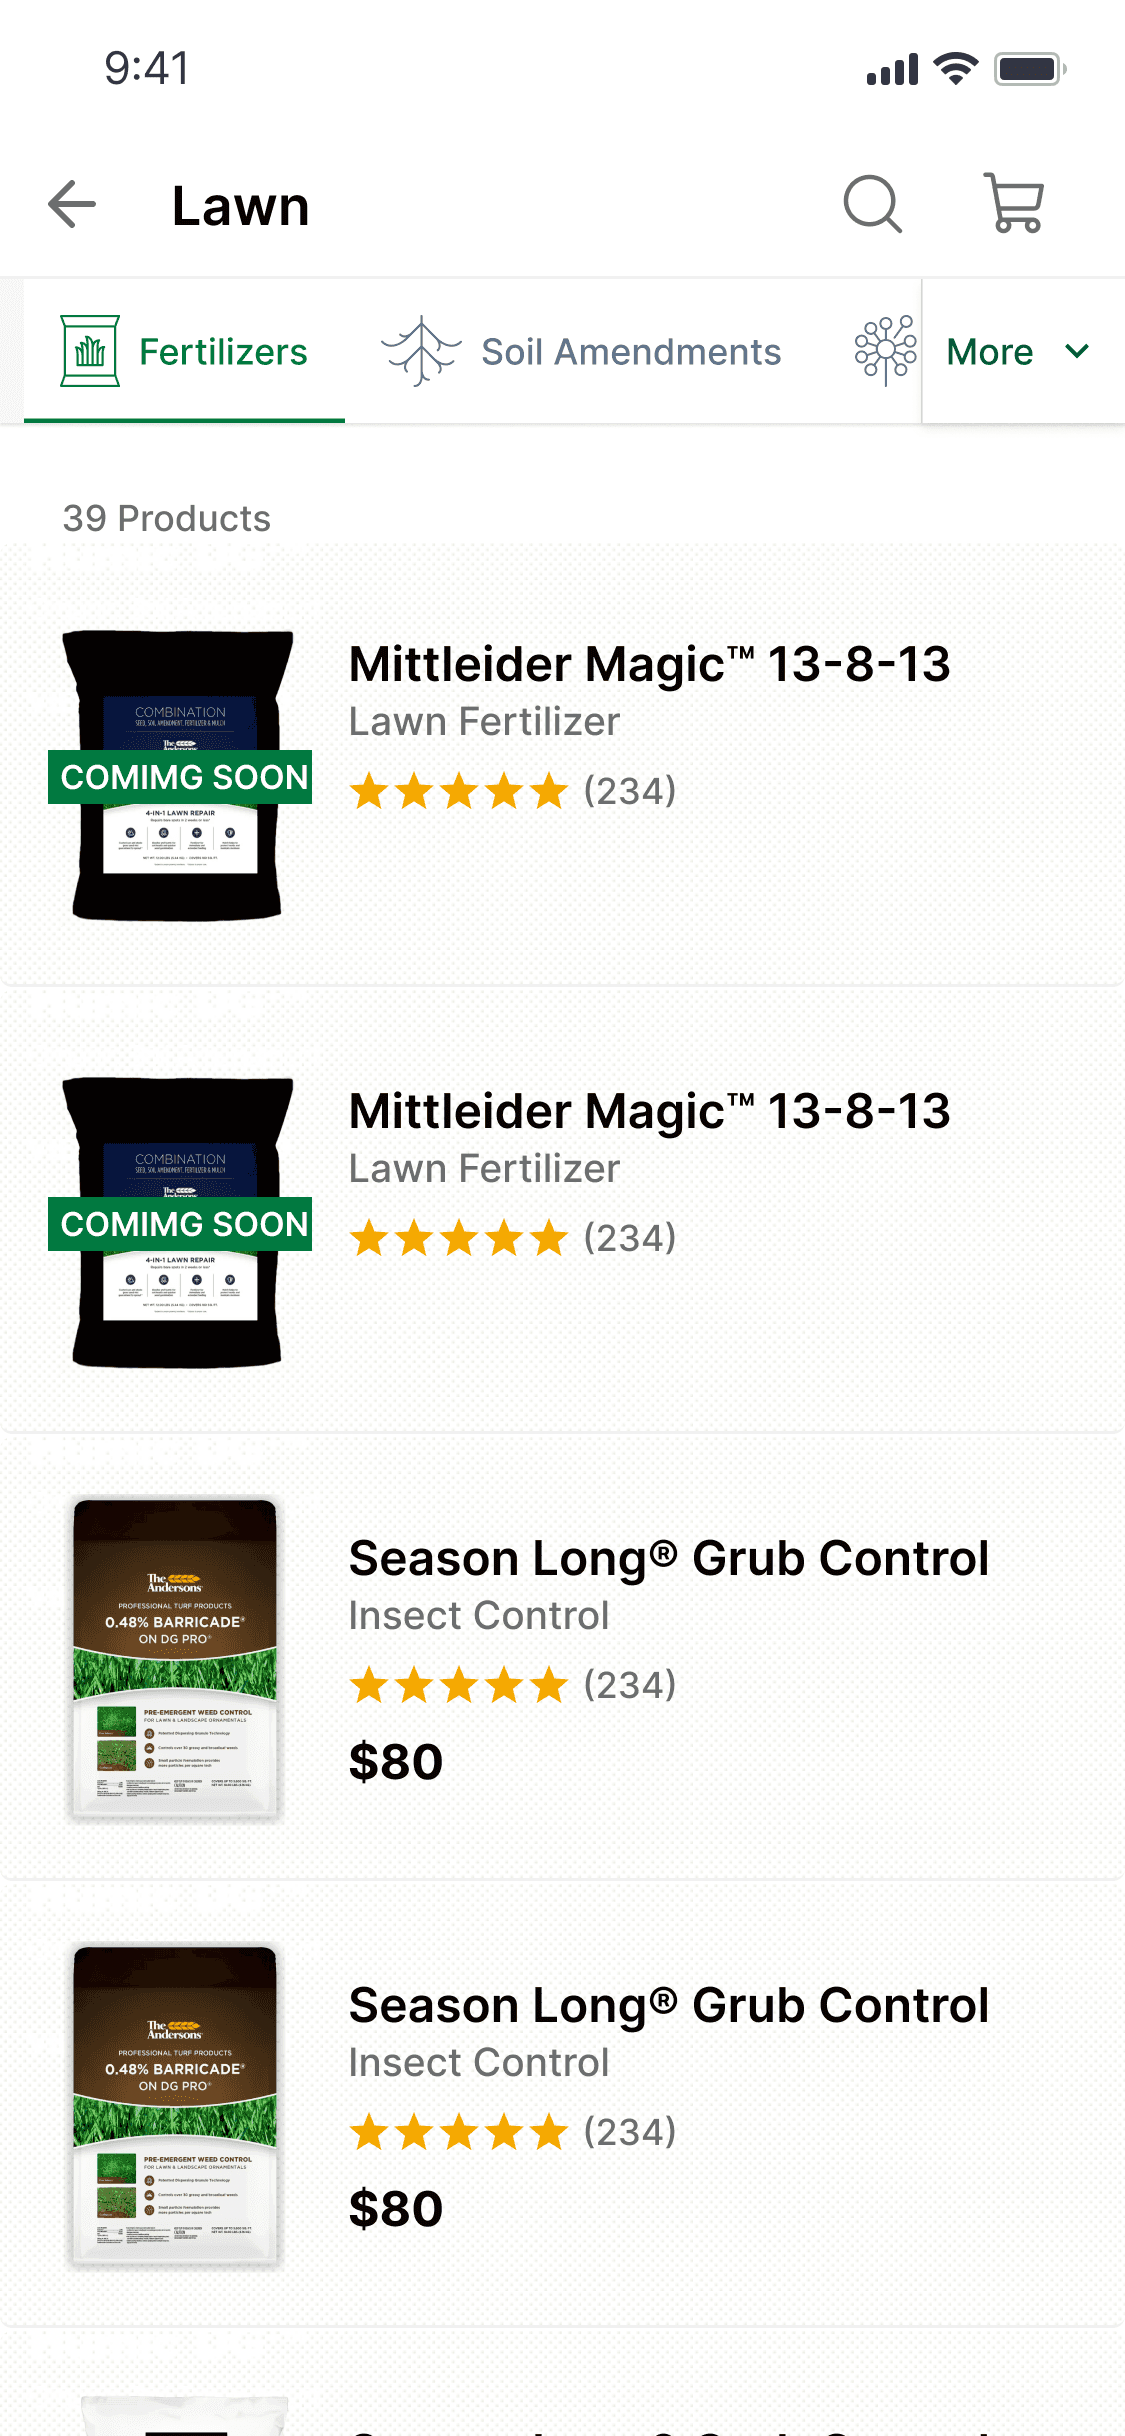
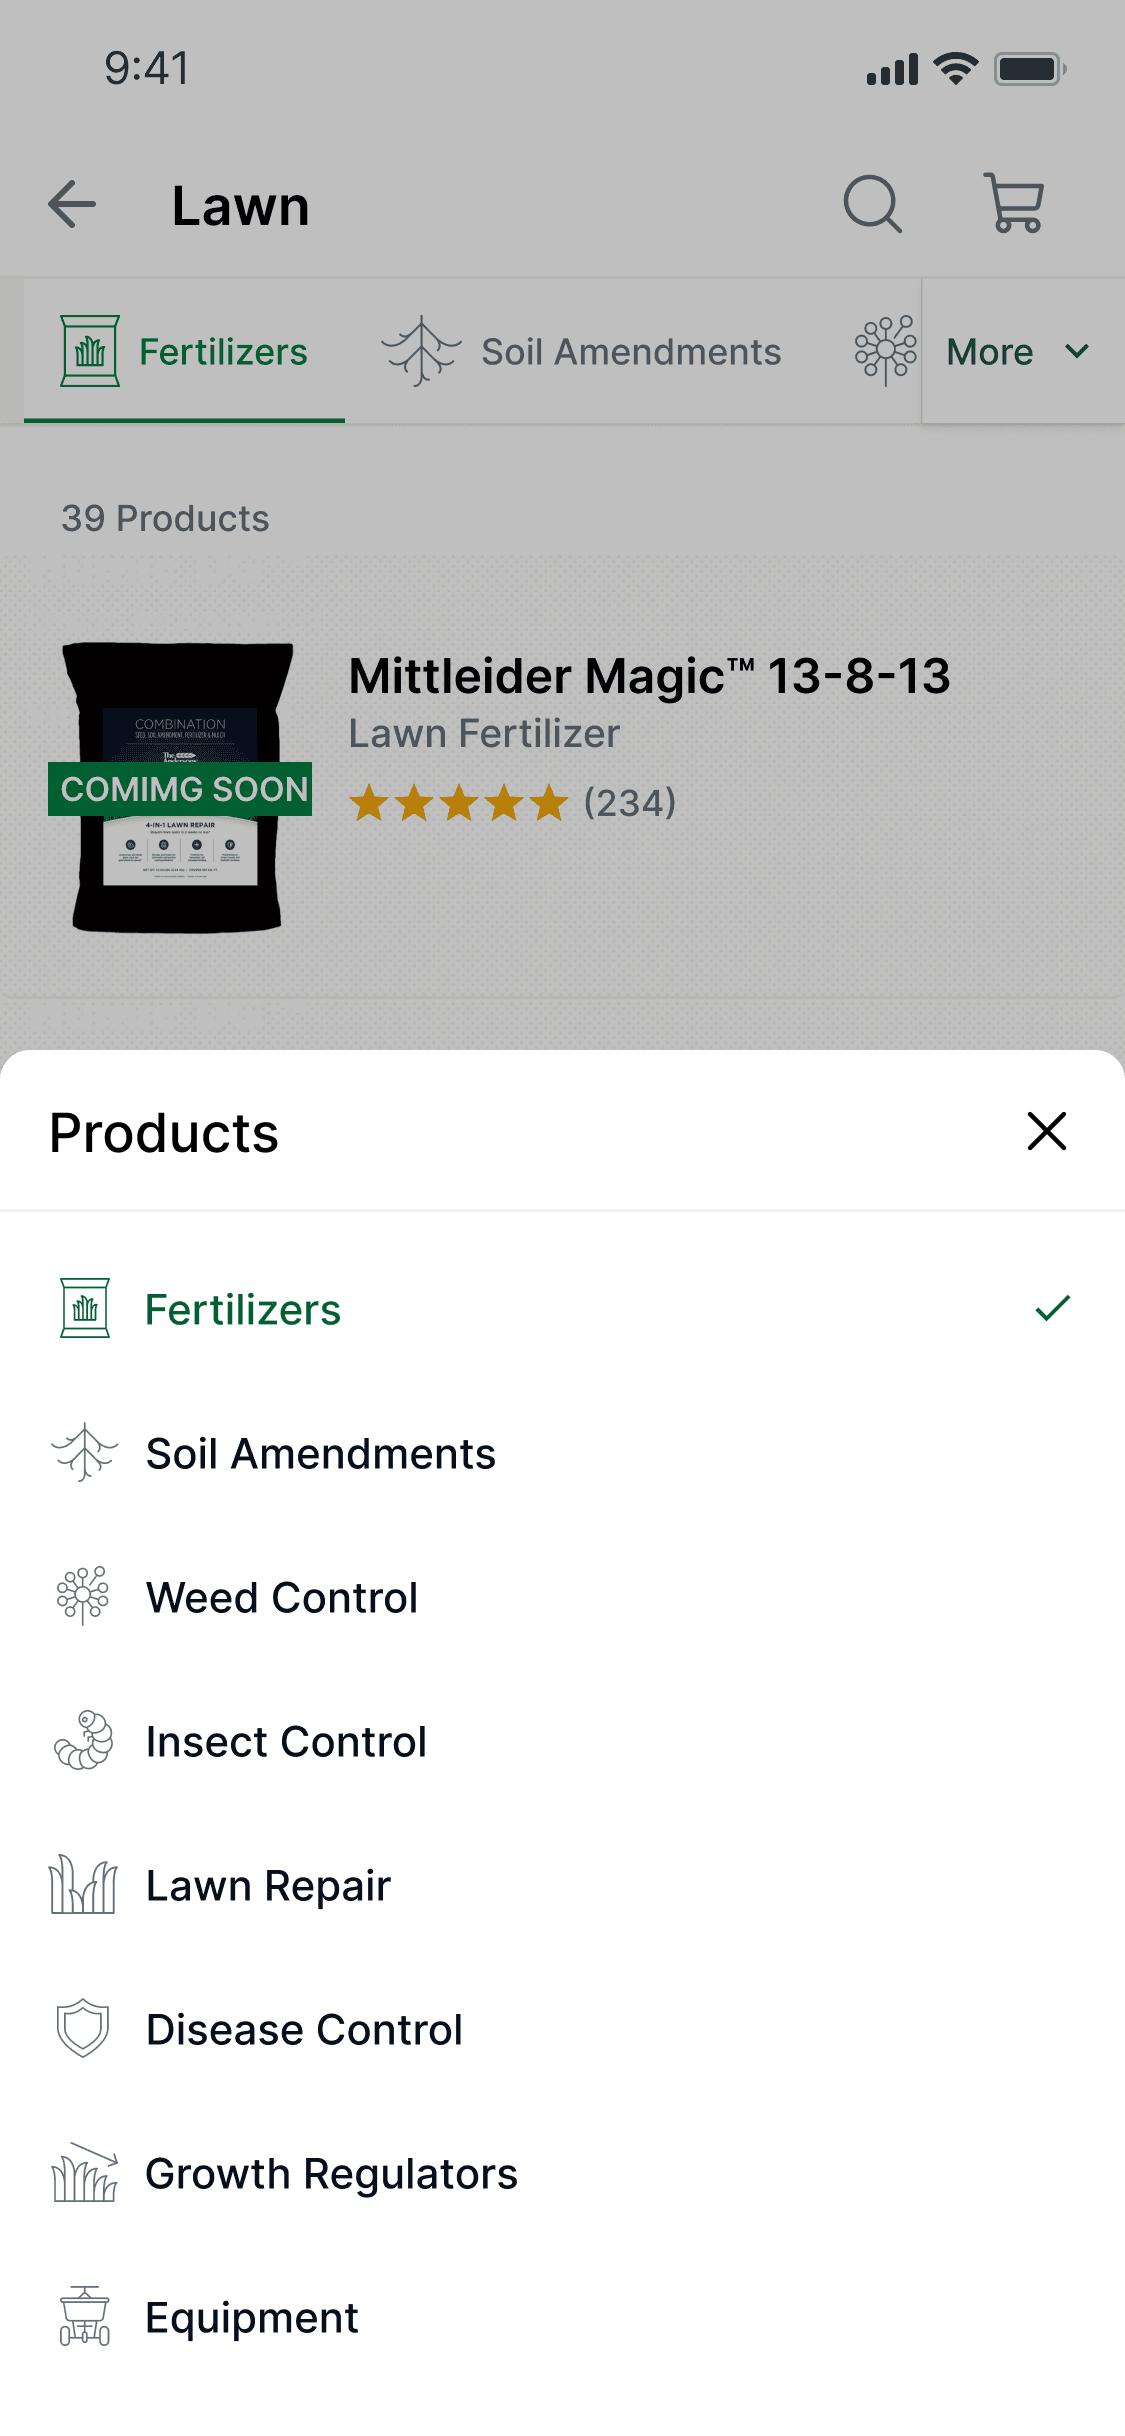
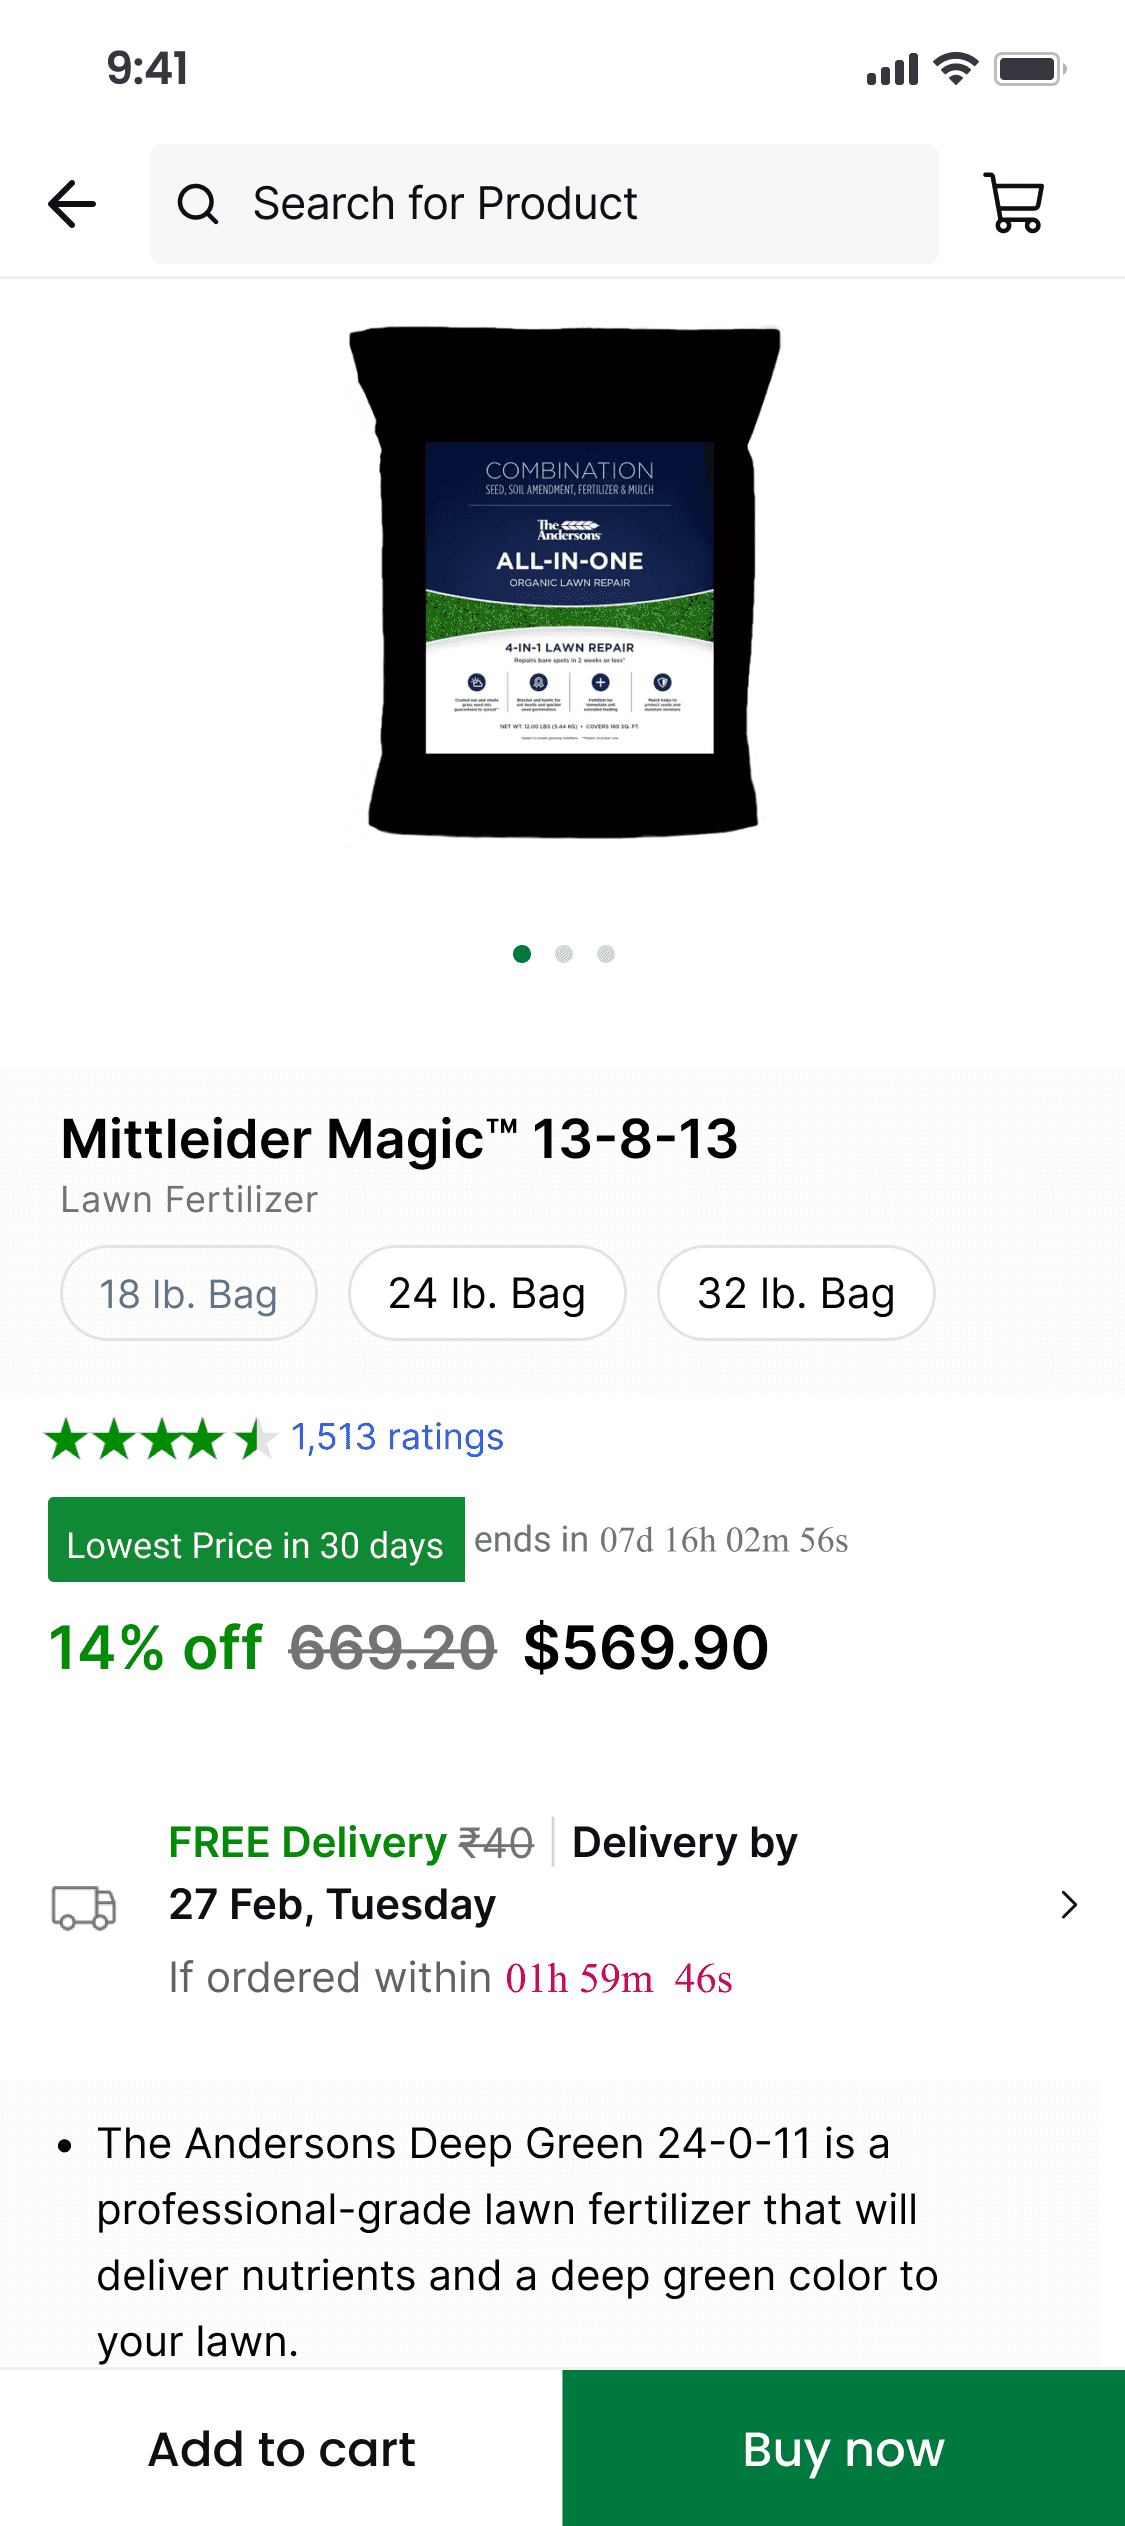
What dose the existing experience look like?

Design Process
⛏
Detailed work under process
Sample Presentation
Introduction
Andersons, a leading e-commerce platform specializing in garden-related products, aimed to address the challenge of high drop-off rates among first-time users on its homepage. This case study outlines the strategies implemented to enhance user engagement and improve the browsing experience for new users.
Problem
Andersons identified that 8% of first-time visitors were leaving the platform without exploring beyond the homepage. The primary objective was to convert these users into explorative and transacting customers by making the homepage intuitive, navigable, and clutter-free.
User Research
Identified two key questions
How to determine user preferences?
How to guide users to relevant products?
Explored explicit methods, particularly via onboarding and the homepage, as the most suitable approach for first-time users in the garden product niche.
Identified User Intent
Introduced an Explicit Intent Capture Widget on the homepage, focusing on garden-related product preferences.
Designed two states for the widget: initial display and post-user interaction.
Allowed users to select preferred product categories such as plants, tools, or decor for tailored recommendations.
Guided Discovery Construct
Recognized the importance of guiding users in their product discovery journey, especially in a niche market like garden products.
Explored personalization and implicit signals for enhancing user experience.
Adopted a guided discovery approach, focusing on opening a category page aligned with user intent, such as specific plant types or gardening tools.
Design ideate & Iteration
Conducted multiple brainstorming sessions to refine the design, considering the unique requirements of garden product shoppers.
Explored various layouts and communication methods for the homepage, prioritizing clear categorization and visual cues.
Identified the winning variant that directed users to the last product category viewed, ensuring a seamless browsing experience.
View Prototype


Implementation
Deployed the explicit intent widget with a significant adoption rate, tailored to garden product preferences.
Implemented the guided discovery approach, leading to a notable increase in first and second-order placements.
Incorporated morph transitions to educate users about the browsing paradigm shift and enhance comprehension.
KPI Metrics

Homepage Drop-off Rate:
KPI Definition: Percentage of first-time users who leave the homepage without exploring further.
Measurement Method: Analyze user session data to track the proportion of users exiting the homepage without engaging with other sections of the platform.
Target: Decrease the homepage drop-off rate by X% within a specified timeframe.
Adoption Rate of Explicit Intent Widget:
KPI Definition: Percentage of users who interact with the Explicit Intent Capture Widget on the homepage.
Measurement Method: Monitor user interactions with the widget through event tracking or analytics tools.
Target: Achieve an adoption rate of at least X%, indicating successful engagement with the widget among new users.
Average Session Duration:
KPI Definition: Average length of time users spend on the Andersons' platform per session.
Measurement Method: Calculate the total duration of user sessions and divide by the number of sessions to obtain the average.
Target: Increase the average session duration by X%, indicating improved user engagement and interest in browsing products.
Retention Rate:
KPI Definition: Percentage of users who continue to engage with Andersons' platform over time.
Measurement Method: Track user retention by monitoring the number of active users compared to the total user base over specified intervals (e.g., monthly or quarterly).
Target: Increase the retention rate by X% to demonstrate sustained user interest and loyalty towards the platform.
more..
Impact
15%
Increase in orders
32%
Exploration rate increased
Conclusion
Andersons successfully addressed the challenge of high drop-off rates among first-time users by implementing user-centric design strategies tailored to the garden product niche. By optimizing the homepage experience and facilitating guided product discovery, Andersons improved user engagement and conversion rates, ultimately enhancing the platform's competitiveness in the market.
Future Scope
Continuously monitor user feedback and behavior to refine the browsing experience further, considering seasonal trends and gardening preferences.
Explore additional personalization techniques, such as region-specific recommendations or gardening project inspiration, to cater to diverse user needs.
Conduct A/B testing to validate design changes and optimize conversion pathways continuously, ensuring ongoing improvement and innovation.